How can I track a group of students over time from the dashboard?
We created this how-to document based on a question we received through our support portal recently:
"I would like to filter a list of student names that started at [Insert School Name Here] in the 2016-17 school year and still remain at [Insert School Name Here] in order to follow their growth data over the last 2 1/2 years."
If you've had similar questions, this how-to guide will show you an easy solution.
Step-by-step guide
We are going to assume that you are familiar enough with the dashboard to navigate to the Essentials Module. If not, feel free to reach out to us for support.
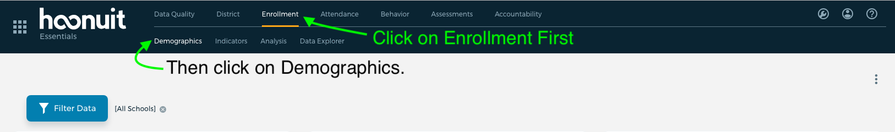
- We're going to use a graph in the demographics dashboard under enrollment. So first click on Enrollment on the top row and then click on Demographics on the row below it in the navigation bar.
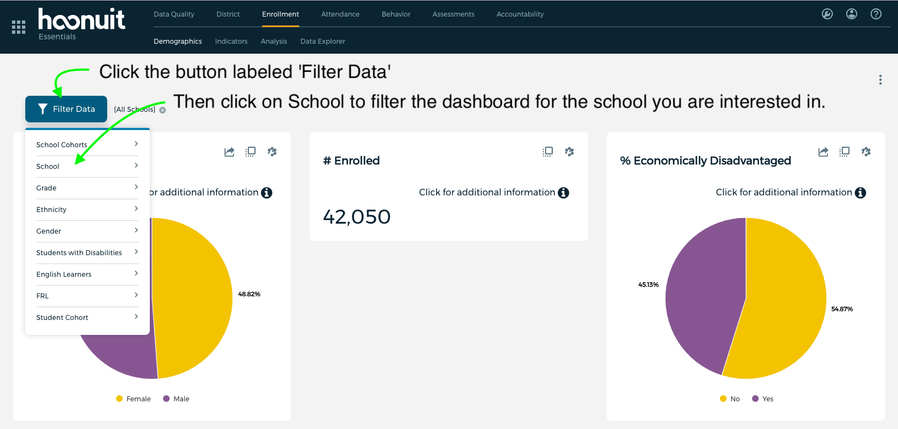
- Next, you'll need to filter the dashboard. Click on the Filter Data button then click on the word School to see the different school options.
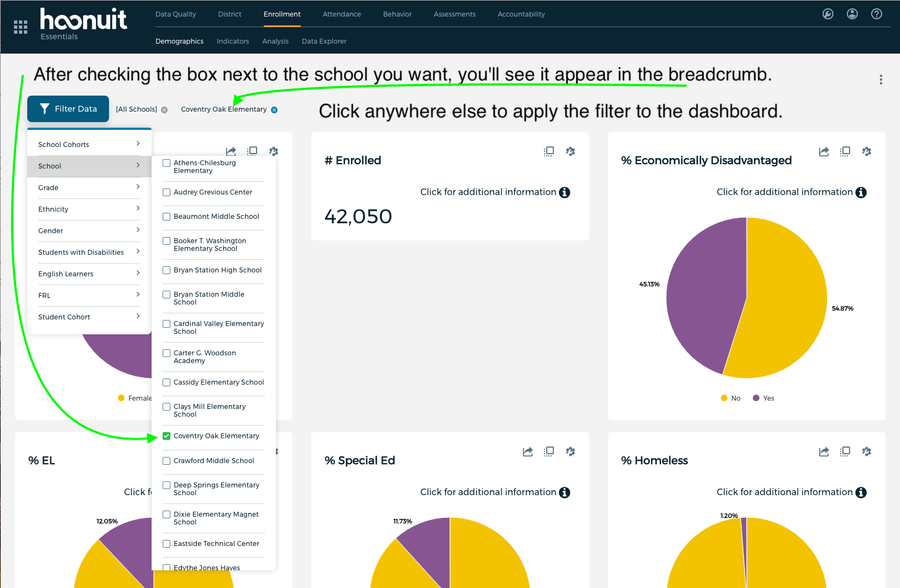
- Check the box for the school you are interested in and then click on any of the blank space on the page to apply the filter to the dashboard.
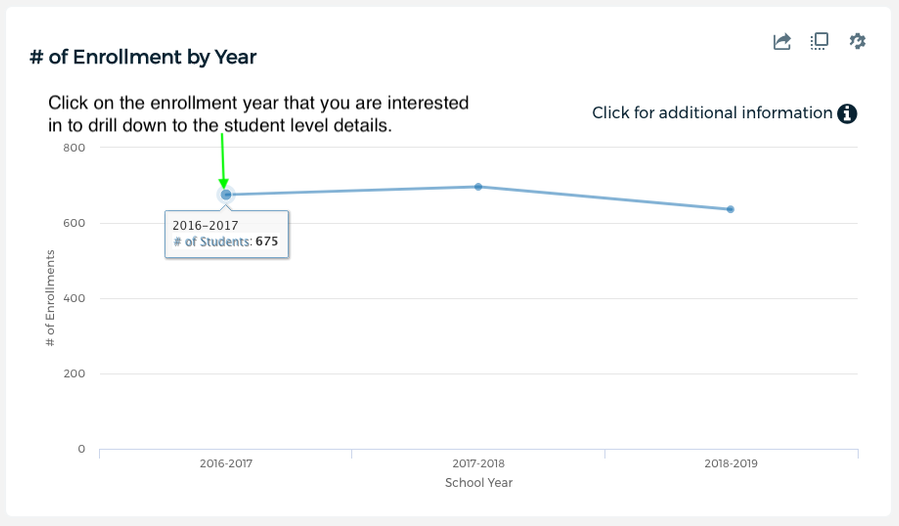
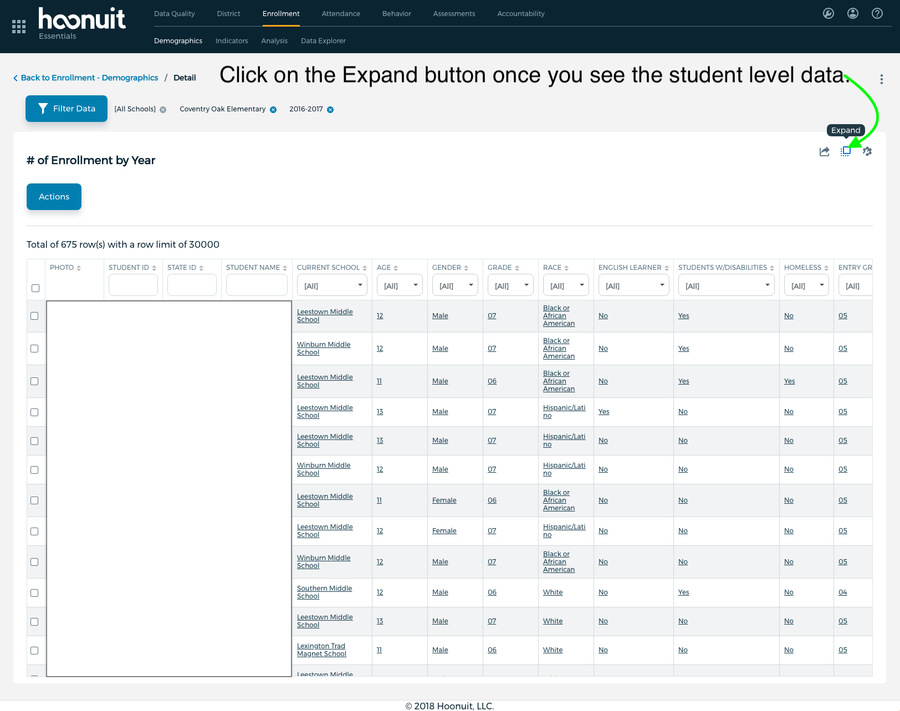
- Next, scroll down until you see this graph and click on the point representing the year you are interested in.
- Once you've drilled in to the graph, click on the button on the top right indicated in the screen shot below.
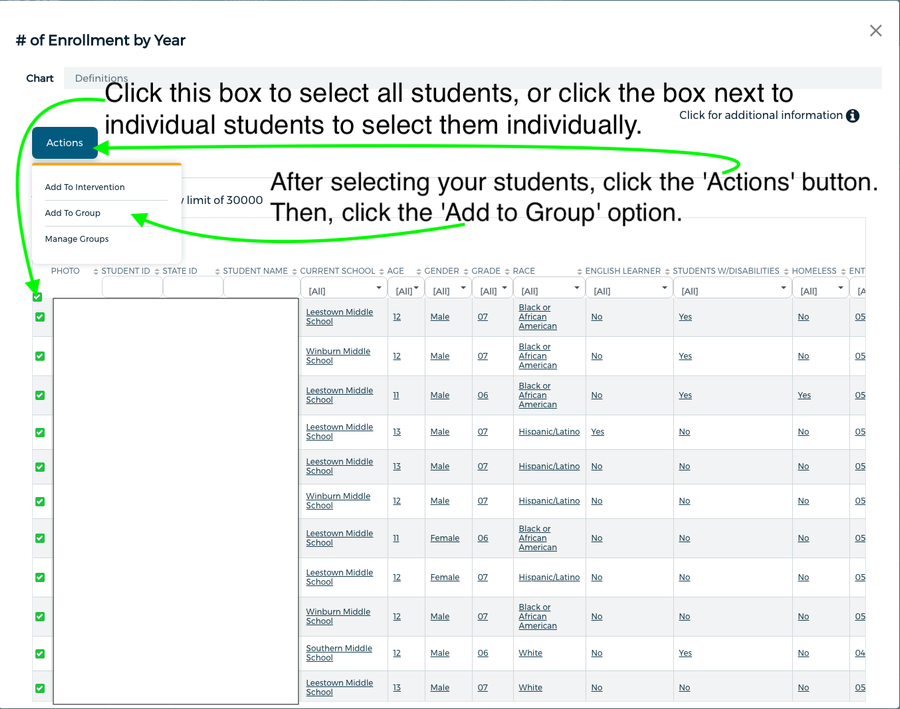
- This will open a popup window where you can select all, or some, of the students. Once you finish selecting the students you'd like to track, click on the Actions button and then select Add To Group.
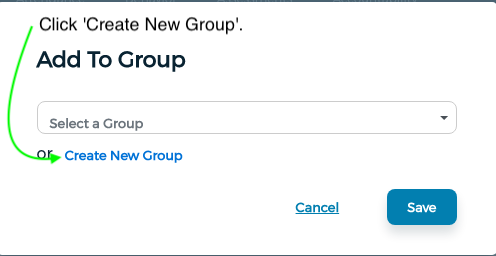
- If you already had a group that you wanted to add the students to you could click the drop down menu labeled 'Select a Group' in the image below. We'll assume that this is a brand new group that you want to create, so click the link shown in the image below.
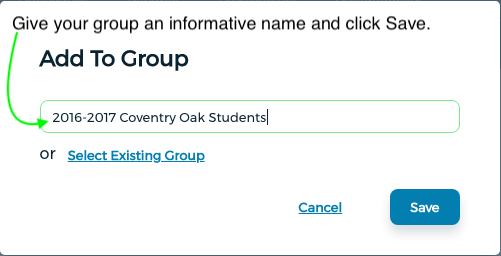
- Create a highly descriptive name for your cohort to make sure it will make sense to you in the future (or others if you plan to share the group) and click save.
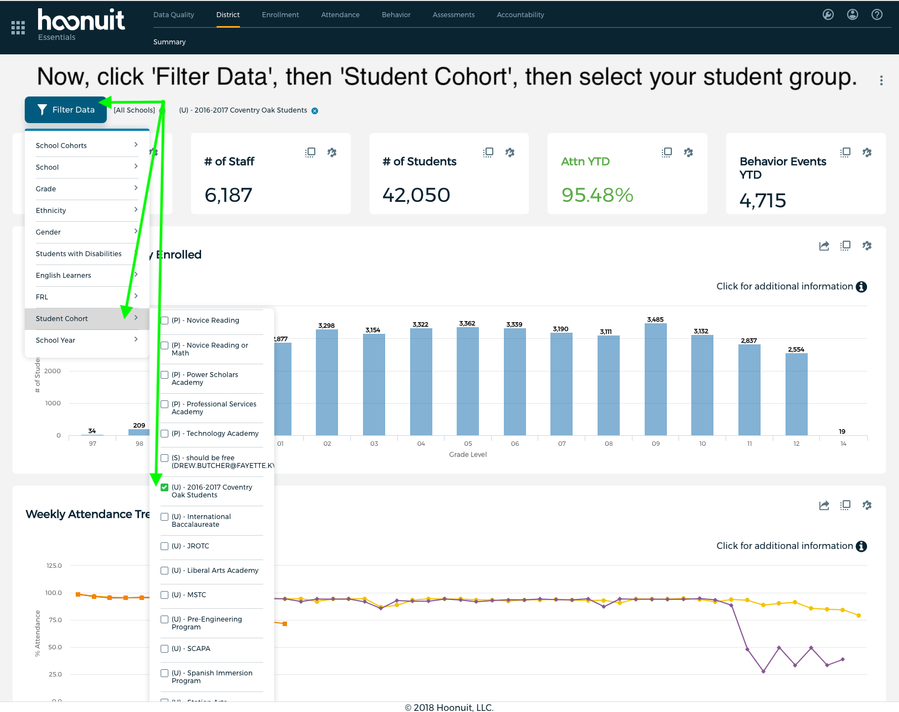
- To filter dashboard content for this group of students, click the Filter Data button, then click on Student Cohort, and click the box for the student group you are interested in. Once you've done that, click on any blank space in the dashboard to apply the filter.
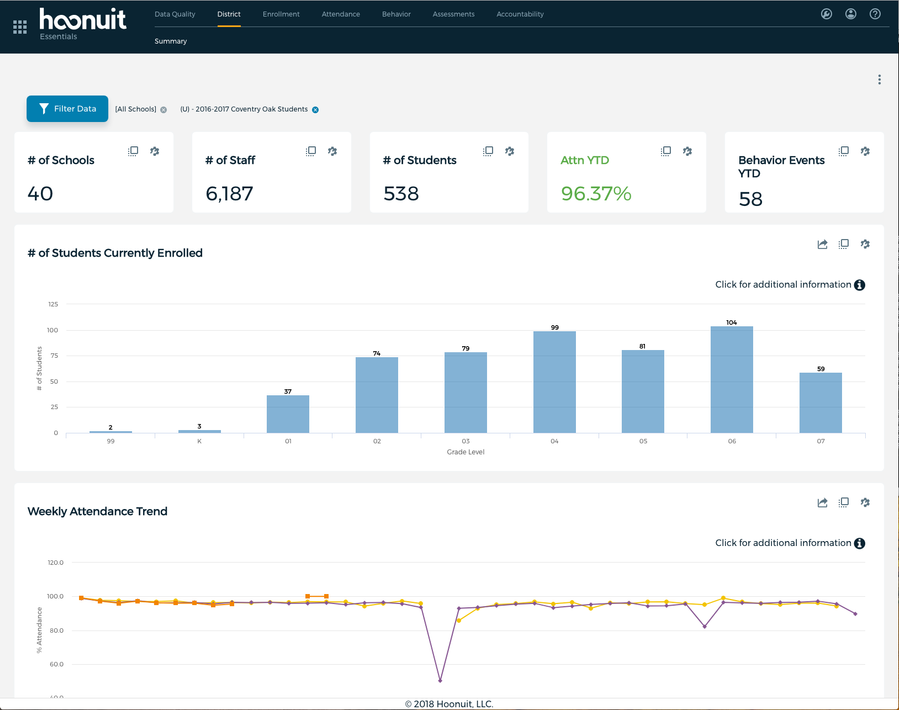
- This will bring up the students from the student group that you created. If you wanted to view students who are still enrolled in the same school, you could follow the instructions from step 2 as well and you would filter only students currently enrolled at the school of your choice from your student group.
Nearly every visualization in the dashboard filters down to only active students. Using the graph in the example above allows us to identify students who were enrolled in the school of interest in the past.
Related articles